7. Subplots y figuras múltiples

Profundizamos en la creación de diseños complejos con Matplotlib, aprovechando la API orientada a objetos dentro de proyectos desarrollados con Python.

Los ejemplos se apoyan en NumPy para generar datos y muestran cómo combinar subplots, ejes compartidos y GridSpec.

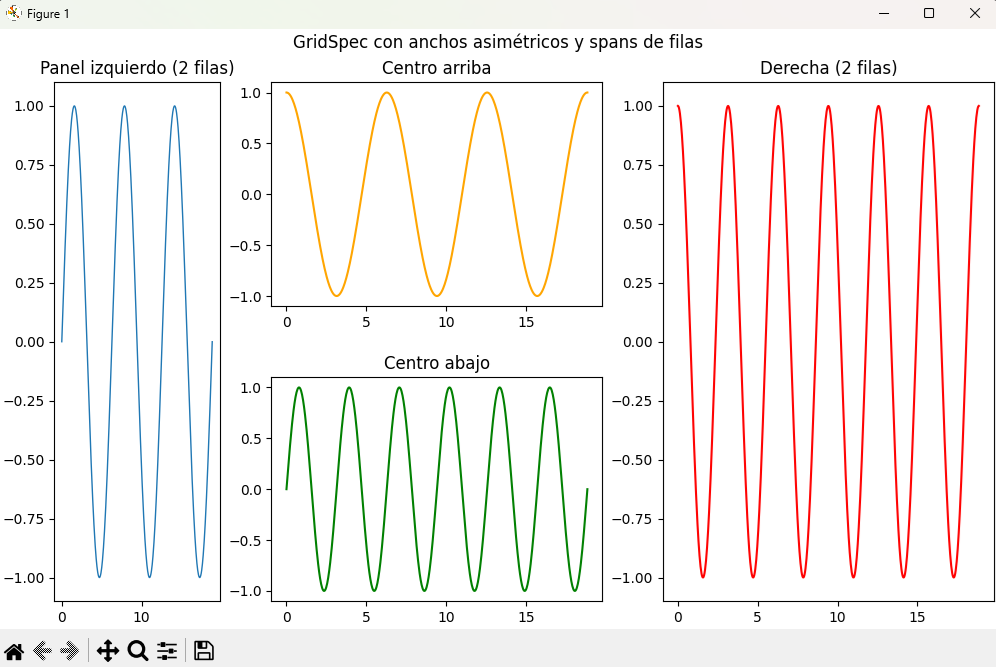
7.1 Uso de subplot y subplots

plt.subplot sigue el estilo imperativo clásico, mientras que plt.subplots devuelve la pareja (fig, ax) y simplifica el trabajo con la API moderna.

Ejemplo básico con subplots

import numpy as np
import matplotlib.pyplot as plt

x = np.linspace(0, 2 * np.pi, 200)

# Sintaxis moderna: Figure y arreglo de Axes
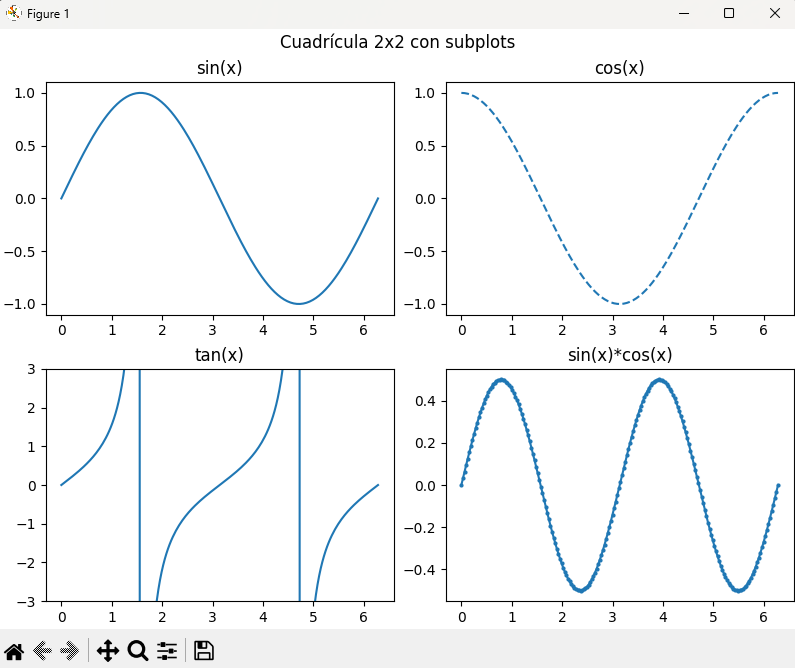
fig, axs = plt.subplots(nrows=2, ncols=2, figsize=(8, 6), layout='constrained')
# 'layout="constrained"' ayuda a evitar solapamientos de textos y etiquetas.

axs[0, 0].plot(x, np.sin(x))
axs[0, 0].set_title("sin(x)")

axs[0, 1].plot(x, np.cos(x), linestyle="--")
axs[0, 1].set_title("cos(x)")

axs[1, 0].plot(x, np.tan(x))
axs[1, 0].set_title("tan(x)")
axs[1, 0].set_ylim(-3, 3)  # Acotar tan(x)

axs[1, 1].plot(x, np.sin(x) * np.cos(x), marker="o", markersize=2, linestyle="-")
axs[1, 1].set_title("sin(x)*cos(x)")

fig.suptitle("Cuadrícula 2x2 con subplots", fontsize=12)
plt.show()
Cuadricula 2x2 generada con subplots

Preferí layout='constrained' (o constrained_layout=True) para que Matplotlib gestione los márgenes.

  • fig, ax = plt.subplots() devuelve un arreglo de Axes cuando nrows * ncols > 1.
  • Usá axes.flat para iterar sobre todos los subplots con un solo bucle.

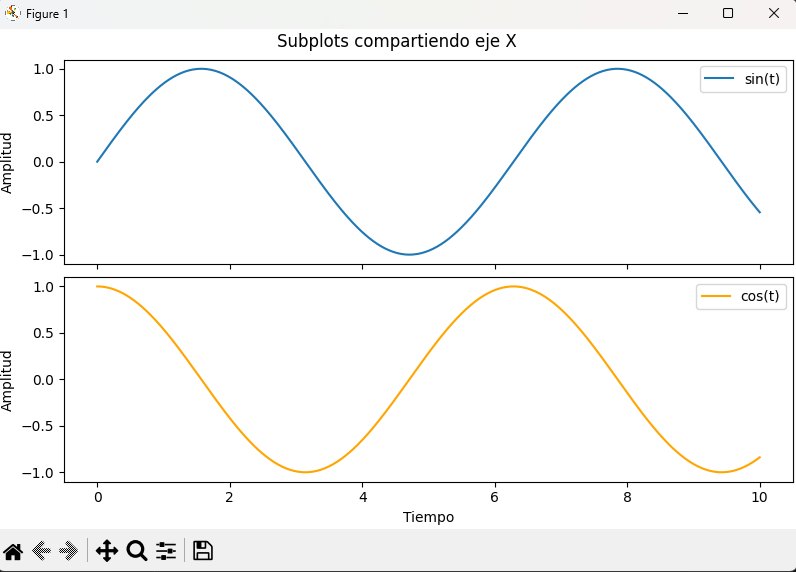
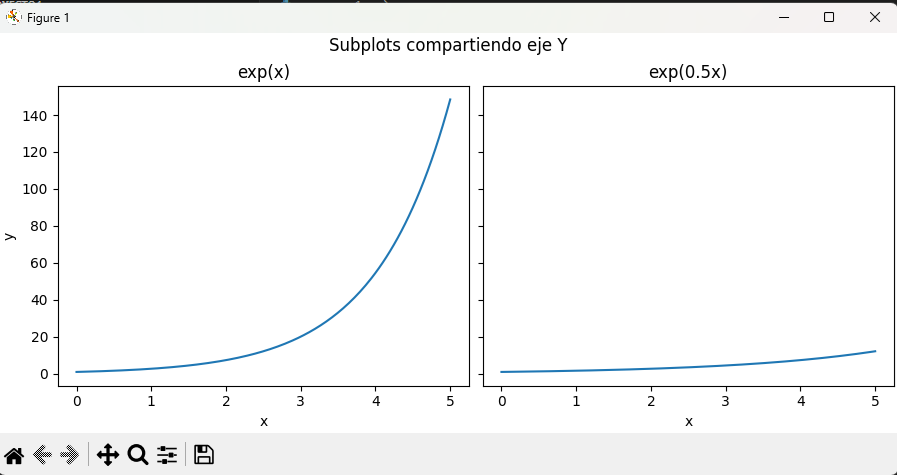
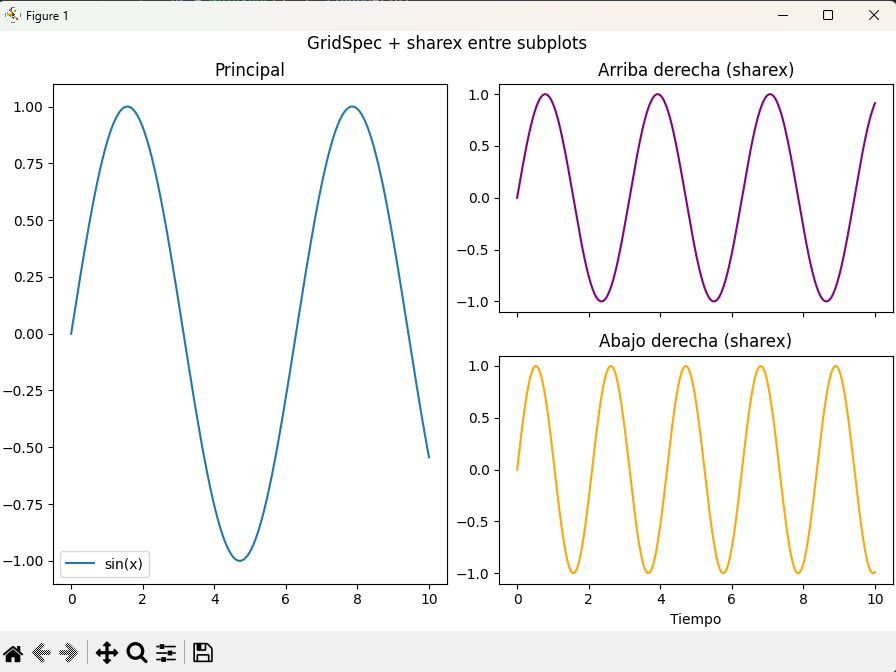
7.2 Compartir ejes (sharex, sharey)

Compartir ejes sincroniza límites, ticks y zoom/pan entre subplots, ideal para comparaciones en la misma escala.

Compartir eje X

import numpy as np
import matplotlib.pyplot as plt

t = np.linspace(0, 10, 500)
s1 = np.sin(t)
s2 = np.cos(t)

fig, (ax1, ax2) = plt.subplots(2, 1, sharex=True, figsize=(8, 5), layout='constrained')

ax1.plot(t, s1, label="sin(t)")
ax1.set_ylabel("Amplitud")
ax1.legend()

ax2.plot(t, s2, color="orange", label="cos(t)")
ax2.set_xlabel("Tiempo")
ax2.set_ylabel("Amplitud")
ax2.legend()

fig.suptitle("Subplots compartiendo eje X")
plt.show()
Subplots compartiendo el eje X en Matplotlib

Compartir eje Y

import numpy as np
import matplotlib.pyplot as plt

x = np.linspace(0, 5, 200)

fig, (ax1, ax2) = plt.subplots(1, 2, sharey=True, figsize=(9, 4), layout='constrained')

ax1.plot(x, np.exp(x))
ax1.set_title("exp(x)")
ax1.set_xlabel("x")
ax1.set_ylabel("y")

ax2.plot(x, np.exp(0.5 * x))
ax2.set_title("exp(0.5x)")
ax2.set_xlabel("x")

fig.suptitle("Subplots compartiendo eje Y")
plt.show()
Subplots compartiendo el eje Y en Matplotlib

💡 Podés combinar sharex=True y sharey=True para cuadrículas completas.

7.3 Diseño avanzado con GridSpec

GridSpec permite composiciones flexibles: celdas de distinto tamaño, subplots que abarcan varias filas/columnas y control de proporciones.

Conceptos clave

  • Definí la grilla con GridSpec(nrows, ncols).
  • Creá ejes con fig.add_subplot(gs[fila_ini:fila_fin, col_ini:col_fin]).
  • Usá width_ratios y height_ratios para ajustar proporciones.

Ejemplo 1: Subplot grande + dos pequeños

import numpy as np
import matplotlib.pyplot as plt
from matplotlib.gridspec import GridSpec

x = np.linspace(0, 2 * np.pi, 300)

fig = plt.figure(figsize=(9, 6), layout='constrained')
gs = GridSpec(nrows=2, ncols=2, figure=fig, height_ratios=[2, 1])

ax_top = fig.add_subplot(gs[0, :])
ax_top.plot(x, np.sin(x), label="sin(x)")
ax_top.plot(x, np.cos(x), label="cos(x)")
ax_top.set_title("Superior: sin y cos")
ax_top.legend()

ax_bl = fig.add_subplot(gs[1, 0])
ax_bl.plot(x, np.sin(2 * x), color="purple")
ax_bl.set_title("Inferior Izq: sin(2x)")

ax_br = fig.add_subplot(gs[1, 1])
ax_br.plot(x, np.cos(2 * x), color="green")
ax_br.set_title("Inferior Der: cos(2x)")

fig.suptitle("Diseño avanzado con GridSpec (1 grande arriba, 2 abajo)")
plt.show()
Diseno GridSpec con subplot superior y dos inferiores

Ejemplo 2: Columnas asimétricas y subplot que abarca filas

import numpy as np
import matplotlib.pyplot as plt
from matplotlib.gridspec import GridSpec

t = np.linspace(0, 6 * np.pi, 600)

fig = plt.figure(figsize=(10, 6), layout='constrained')
gs = GridSpec(
    nrows=2,
    ncols=3,
    figure=fig,
    width_ratios=[1, 2, 2],
    height_ratios=[1, 1]
)

ax_left = fig.add_subplot(gs[:, 0])
ax_left.plot(t, np.sin(t), linewidth=1)
ax_left.set_title("Panel izquierdo (2 filas)")

ax_c_top = fig.add_subplot(gs[0, 1])
ax_c_top.plot(t, np.cos(t), color="orange")
ax_c_top.set_title("Centro arriba")

ax_c_bot = fig.add_subplot(gs[1, 1])
ax_c_bot.plot(t, np.sin(2 * t), color="green")
ax_c_bot.set_title("Centro abajo")

ax_right = fig.add_subplot(gs[:, 2])
ax_right.plot(t, np.cos(2 * t), color="red")
ax_right.set_title("Derecha (2 filas)")

fig.suptitle("GridSpec con anchos asimétricos y spans de filas")
plt.show()
GridSpec con columnas asimetricas y spans

Ejemplo 3: Compartir ejes dentro de GridSpec

import numpy as np
import matplotlib.pyplot as plt
from matplotlib.gridspec import GridSpec

x = np.linspace(0, 10, 400)

fig = plt.figure(figsize=(9, 6), layout='constrained')
gs = GridSpec(2, 2, figure=fig)

ax_main = fig.add_subplot(gs[:, 0])
ax_tr = fig.add_subplot(gs[0, 1], sharex=ax_main)
ax_br = fig.add_subplot(gs[1, 1], sharex=ax_main)

ax_main.plot(x, np.sin(x), label="sin(x)")
ax_main.set_title("Principal")
ax_main.legend()

ax_tr.plot(x, np.sin(2 * x), color="purple")
ax_tr.set_title("Arriba derecha (sharex)")

ax_br.plot(x, np.sin(3 * x), color="orange")
ax_br.set_title("Abajo derecha (sharex)")
ax_br.set_xlabel("Tiempo")

plt.setp(ax_tr.get_xticklabels(), visible=False)

fig.suptitle("GridSpec + sharex entre subplots")
plt.show()
GridSpec con subplots que comparten eje X

🔧 La clase GridSpec forma parte de matplotlib.gridspec y ofrece un control detallado sin abandonar la API OO.

Buenas prácticas y checklist

  • Usá plt.subplots para cuadrículas regulares y GridSpec para diseños asimétricos.
  • Activá layout='constrained' para evitar solapamientos de textos.
  • Compartí ejes (sharex, sharey) cuando necesites comparar series en la misma escala.
  • Rotulá cada subplot con set_title, set_xlabel y set_ylabel.
  • Añadí un título global con fig.suptitle y ajustá proporciones con width_ratios/height_ratios según sea necesario.
  • Ocultá etiquetas redundantes en ejes compartidos con plt.setp(..., visible=False) para mejorar la lectura.