12 - Proyecto final del tutorial
El proyecto final plantea un reto más interesante: simular la detección de duplicados en lecturas de sensores, comparar algoritmos con distintos órdenes de crecimiento, medir tiempos reales y mostrar un gráfico ASCII directamente en consola para ver la curva.
12.1 Escribir funciones con distintos Big-O
def constante(n):  # O(1)
  return 42

def suma_lineal(v):  # O(n)
  total = 0
  for x in v:
    total += x
  return total

def busca_cuadratica(v):  # O(n^2)
  for i in range(len(v)):
    for j in range(i + 1, len(v)):
      if v[i] == v[j]:
        return True
  return False
Prepara entradas de distinto tamaño para ver cómo crece el tiempo en cada función.
12.2 Medir tiempo real y compararlo con el teórico
import time

def medir_segundos(fn, v, rep=2000):
  fn(v)  # calentamiento
  inicio = time.perf_counter()
  for _ in range(rep):
    fn(v)
  fin = time.perf_counter()
  total = fin - inicio
  promedio = total / rep
  return total, promedio
Imprime tiempo total y promedio por corrida para evitar confusiones cuando rep es grande.
12.3 Implementar un gráfico simple por consola
def grafico_ascii(ns, tiempos):
  max_t = max(tiempos) if tiempos else 0.0
  for n, t in zip(ns, tiempos):
    barras = 0 if max_t == 0 else int((t / max_t) * 50)
    print(f"{n:6d} | " + "#" * barras + f" {t:.6f} s")
Grafica tiempos totales para que la escala sea clara incluso con pocas microsegundos por corrida.
12.4 Optimizar versiones lentas
- Sustituye la búsqueda cuadrática por ordenar y contar en
O(n log n). - Reemplaza loops anidados por estructuras como
setpara llegar aO(n)promedio. - Comprueba la mejora midiendo antes y después.
12.5 Crear un menú principal
from benchmark import medir_segundos, grafico_ascii
from funciones import generar_datos, suma_lineal, busca_cuadratica, busca_hash
def medir_con_ns(fn, ns, rep):
tiempos = []
for n in ns:
datos = generar_datos(n)
total, _ = medir_segundos(fn, datos, rep)
tiempos.append(total)
return tiempos
def main():
ns = [500, 1000, 1500, 2000, 2500]
datos_suma = generar_datos(200000)
datos_busca = generar_datos(8000)
while True:
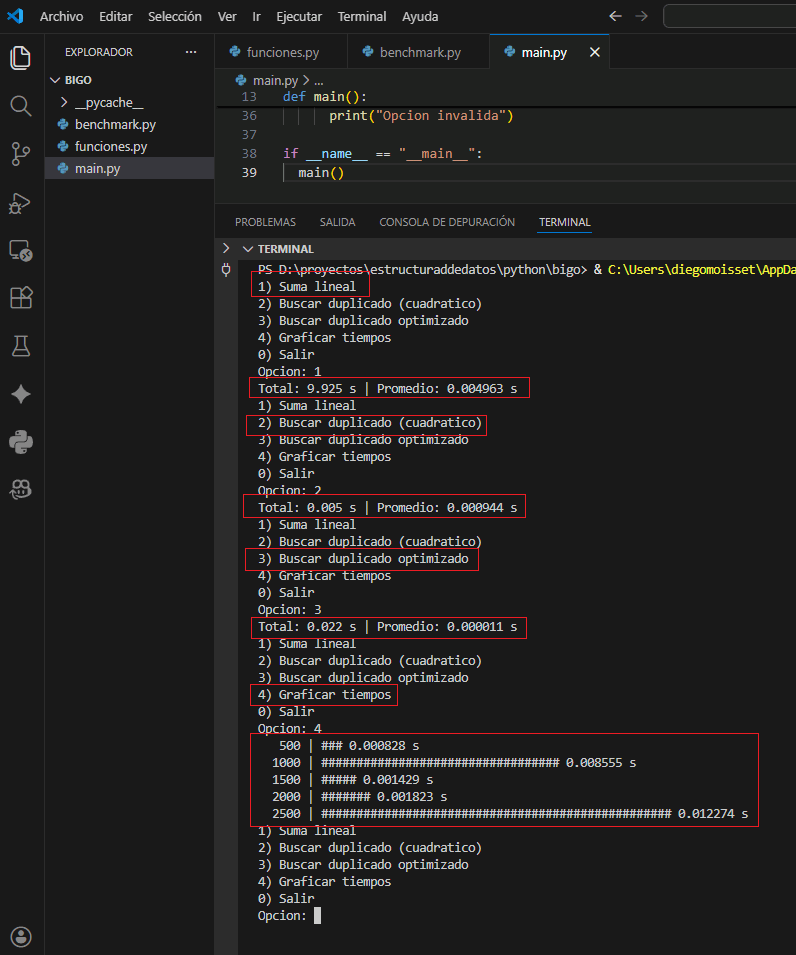
print("1) Suma lineal\n2) Buscar duplicado (cuadratico)\n3) Buscar duplicado optimizado\n4) Graficar tiempos\n0) Salir")
opcion = input("Opcion: ").strip()
if opcion == "1":
total, promedio = medir_segundos(suma_lineal, datos_suma, rep=2000)
print("Total: %.3f s | Promedio: %.6f s" % (total, promedio))
elif opcion == "2":
total, promedio = medir_segundos(busca_cuadratica, datos_busca, rep=5)
print("Total: %.3f s | Promedio: %.6f s" % (total, promedio))
elif opcion == "3":
total, promedio = medir_segundos(busca_hash, datos_busca, rep=2000)
print("Total: %.3f s | Promedio: %.6f s" % (total, promedio))
elif opcion == "4":
tiempos = medir_con_ns(busca_cuadratica, ns, rep=1)
grafico_ascii(ns, tiempos)
elif opcion == "0":
print("Fin")
break
else:
print("Opcion invalida")
if __name__ == "__main__":
main()Ajusta n para que cada prueba tarde un tiempo razonable en tu equipo. La opción de gráfico usa la versión cuadrática con pocas repeticiones para que la curva sea visible sin esperar demasiado.
12.6 Ejecutar y depurar en Python
- Crea un entorno virtual y un proyecto en tu editor (VS Code o PyCharm).
- Ejecuta con
python main.pyy ajusta tamaños de entrada según tu CPU. - Usa breakpoints para inspeccionar variables y asegurarte de que los datos de entrada no se alteren entre pruebas.
- Si necesitas perfilar, usa
cProfilepara detectar cuellos de botella reales.
12.7 Archivos a incorporar en el proyecto
main.py: menú interactivo y orquestación de pruebas.funciones.py: funciones de cada Big-O y generación de datos.benchmark.py: helpers de medición, gráfico ASCII y exportación opcional a CSV.README.md: instrucciones de ejecución, tamaños sugeridos y precauciones de memoria.resultados.csv(opcional): salidas para graficar tiempos.
# funciones.py
import random

MAX_VALOR = 100000

def generar_datos(n, max_valor=MAX_VALOR):
  return [random.randrange(max_valor) for _ in range(n)]

def constante(n):
  return 42

def suma_lineal(v):
  total = 0
  for x in v:
    total += x
  return total

def busca_cuadratica(v):
  for i in range(len(v)):
    for j in range(i + 1, len(v)):
      if v[i] == v[j]:
        return True
  return False

def busca_hash(v):
  vistos = set()
  for valor in v:
    if valor in vistos:
      return True
    vistos.add(valor)
  return False
# benchmark.py
import csv
import time
def medir_segundos(fn, v, rep=2000):
fn(v)
inicio = time.perf_counter()
for _ in range(rep):
fn(v)
fin = time.perf_counter()
total = fin - inicio
promedio = total / rep
return total, promedio
def grafico_ascii(ns, tiempos):
max_t = max(tiempos) if tiempos else 0.0
for n, t in zip(ns, tiempos):
barras = 0 if max_t == 0 else int((t / max_t) * 50)
print(f"{n:6d} | " + "#" * barras + f" {t:.6f} s")
def escribir_csv(ruta, ns, tiempos):
with open(ruta, "w", newline="", encoding="utf-8") as archivo:
writer = csv.writer(archivo)
writer.writerow(["n", "tiempo_s"])
for n, t in zip(ns, tiempos):
writer.writerow([n, f"{t:.6f}"])# main.py
from benchmark import medir_segundos, grafico_ascii
from funciones import generar_datos, suma_lineal, busca_cuadratica, busca_hash
def medir_con_ns(fn, ns, rep):
tiempos = []
for n in ns:
datos = generar_datos(n)
total, _ = medir_segundos(fn, datos, rep)
tiempos.append(total)
return tiempos
def main():
ns = [500, 1000, 1500, 2000, 2500]
datos_suma = generar_datos(200000)
datos_busca = generar_datos(8000)
while True:
print("1) Suma lineal\n2) Buscar duplicado (cuadratico)\n3) Buscar duplicado optimizado\n4) Graficar tiempos\n0) Salir")
opcion = input("Opcion: ").strip()
if opcion == "1":
total, promedio = medir_segundos(suma_lineal, datos_suma, rep=2000)
print("Total: %.3f s | Promedio: %.6f s" % (total, promedio))
elif opcion == "2":
total, promedio = medir_segundos(busca_cuadratica, datos_busca, rep=5)
print("Total: %.3f s | Promedio: %.6f s" % (total, promedio))
elif opcion == "3":
total, promedio = medir_segundos(busca_hash, datos_busca, rep=2000)
print("Total: %.3f s | Promedio: %.6f s" % (total, promedio))
elif opcion == "4":
tiempos = medir_con_ns(busca_cuadratica, ns, rep=1)
grafico_ascii(ns, tiempos)
elif opcion == "0":
print("Fin")
break
else:
print("Opcion invalida")
if __name__ == "__main__":
main()