73 - tkinter : control Canvas
El control Canvas nos permite acceder a una serie de primitivas gráficas: líneas, rectángulos, óvalos, arcos etc. para graficar dentro de la misma.
Problema:
Confeccionar un programa que cree un objeto de la clase Canvas y muestre la funcionalidad de las principales primitivas gráficas.
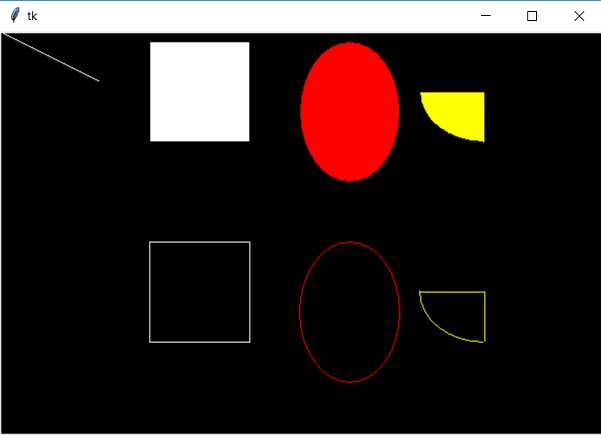
La interfaz visual debe ser similar a esta:
Programa: ejercicio254.py
import tkinter as tk

class Aplicacion:
    def __init__(self):
        self.ventana1=tk.Tk()
        self.canvas1=tk.Canvas(self.ventana1, width=600, height=400, background="black")
        self.canvas1.grid(column=0, row=0)
        self.canvas1.create_line(0, 0, 100,50, fill="white")
        self.canvas1.create_rectangle(150,10, 250,110, fill="white")
        self.canvas1.create_oval(300,10,400,150, fill="red")
        self.canvas1.create_arc(420,10,550,110, fill="yellow", start=180, extent=90)
        self.canvas1.create_rectangle(150,210, 250,310, outline="white")
        self.canvas1.create_oval(300,210,400,350, outline="red")
        self.canvas1.create_arc(420,210,550,310, outline="yellow", start=180, extent=90)
        self.ventana1.mainloop()


aplicacion1=Aplicacion()
La clase Canvas se encuentra en el módulo 'tkinter':
import tkinter as tk
Creamos un objeto de la clase Canvas y le pasamos en el primer parámetro la referencia a la ventana donde debe agregarse, los dos parámetros siguientes son el ancho y el alto en píxeles, y finalmente el color de fondo de la componente de tipo Canvas:
self.canvas1=tk.Canvas(self.ventana1, width=600, height=400, background="black")
Igual que cualquier otro Widget debemos ubicarlo mediante grid:
self.canvas1.grid(column=0, row=0)
Debemos hacer referencia a un sistema de ejes x e y. El punto (0,0) se encuentra en el vértice superior izquierdo.
Para dibujar una línea la clase Canvas cuenta con el método 'create_line', El primer y segundo parámetro representan la columna y fila donde se inicia la línea (en nuestro ejemplo 0,0) y los otros dos valores representan la columna y fila donde finaliza nuestra línea:
self.canvas1.create_line(0, 0, 100,50, fill="white")
Para dibujar un rectángulo debemos indicar dos puntos que se encuentren dentro del control Canvas, los dos primeros valores indican el vértice superior izquierdo y los dos siguientes el vértice inferior derecho:
self.canvas1.create_rectangle(150,10, 250,110, fill="white")
El rectángulo aparece con color relleno en blanco dado que pasamos el parámetro fill con dicho valor.
Para dibujar un óvalo los parámetros son idénticos al método 'create_rectangle' con la diferencia que en lugar de dibujar un rectángulo dibuja un óvalo contenido en dicho rectángulo:
self.canvas1.create_oval(300,10,400,150, fill="red")
Para dibujar un trozo de tarta utilizamos el método 'create_arc', los primeros parámetros son idénticos a los métodos 'create_rectangle' y 'create_oval'. El parámetro start indica a partir de que grado debe comenzar el trozo de arco y mediante el parámetro extent indicamos cuantos grados tiene el trozo de tarta:
self.canvas1.create_arc(420,10,550,110, fill="yellow", start=180, extent=90)
Para que solo se pinte el perímetro de la figura no pasamos el parámetro fill y pasamos solo el parámetro outline:
        self.canvas1.create_rectangle(150,210, 250,310, outline="white")
        self.canvas1.create_oval(300,210,400,350, outline="red")
        self.canvas1.create_arc(420,210,550,310, outline="yellow", start=180, extent=90)
Problema:
Crear una aplicación que solicite el ingreso de tres valores por teclado que representan las cantidades de votos obtenidas por tres partidos políticos. Luego mostrar un gráfico de barras horizontales.
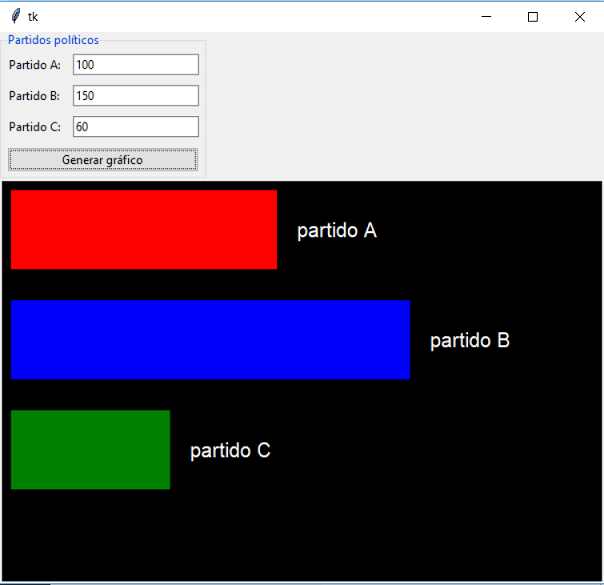
La interfaz visual debe ser similar a esta:
Programa: ejercicio255.py
import tkinter as tk
from tkinter import ttk

class Aplicacion:
    def __init__(self):
        self.ventana1=tk.Tk()
        self.entradadatos()
        self.canvas1=tk.Canvas(self.ventana1, width=600, height=400, background="black")
        self.canvas1.grid(column=0, row=1)
        self.ventana1.mainloop()

    def entradadatos(self):
        self.lf1=ttk.LabelFrame(self.ventana1,text="Partidos políticos")
        self.lf1.grid(column=0, row=0, sticky="w")
        self.label1=ttk.Label(self.lf1, text="Partido A:")
        self.label1.grid(column=0,row=0, padx=5, pady=5)
        self.dato1=tk.StringVar()
        self.entry1=ttk.Entry(self.lf1, textvariable=self.dato1)
        self.entry1.grid(column=1, row=0, padx=5, pady=5)
        self.label2=ttk.Label(self.lf1, text="Partido B:")
        self.label2.grid(column=0,row=1, padx=5, pady=5)
        self.dato2=tk.StringVar()
        self.entry2=ttk.Entry(self.lf1, textvariable=self.dato2)
        self.entry2.grid(column=1, row=1, padx=5, pady=5)
        self.label3=ttk.Label(self.lf1, text="Partido C:")
        self.label3.grid(column=0,row=2, padx=5, pady=5)
        self.dato3=tk.StringVar()
        self.entry3=ttk.Entry(self.lf1, textvariable=self.dato3)
        self.entry3.grid(column=1, row=2, padx=5, pady=5)
        self.boton1=ttk.Button(self.lf1, text="Generar gráfico", command=self.grafico_barra)
        self.boton1.grid(column=0, row=3, columnspan=2, padx=5, pady=5, sticky="we")
        self.entry1.focus()

    def grafico_barra(self):
        self.canvas1.delete(tk.ALL)
        valor1=int(self.dato1.get())
        valor2=int(self.dato2.get())
        valor3=int(self.dato3.get())
        if valor1>valor2 and valor1>valor3:
            mayor=valor1
        else:
            if valor2>valor3:
                mayor=valor2
            else:
                mayor=valor3
        largo1=valor1/mayor*400
        largo2=valor2/mayor*400
        largo3=valor3/mayor*400
        self.canvas1.create_rectangle(10,10,10+largo1,90,fill="red")
        self.canvas1.create_rectangle(10,120,10+largo2,200,fill="blue")
        self.canvas1.create_rectangle(10,230,10+largo3,310,fill="green")
        self.canvas1.create_text(largo1+70, 50, text="partido A", fill="white", font="Arial")
        self.canvas1.create_text(largo2+70, 160, text="partido B", fill="white", font="Arial")
        self.canvas1.create_text(largo3+70, 270, text="partido C", fill="white", font="Arial")


aplicacion1=Aplicacion()
En el método __init__ llamamos al método 'entradadatos' que crea el LabelFrame con los 3 controles Entry, 3 controles Label y el botón:
    def __init__(self):
        self.ventana1=tk.Tk()
        self.entradadatos()
        self.canvas1=tk.Canvas(self.ventana1, width=600, height=400, background="black")
        self.canvas1.grid(column=0, row=1)
        self.ventana1.mainloop()
También creamos el objeto 'canvas1' y lo ubicamos en la segunda fila.
Cuando se presiona el botón "Generar gráfico" se ejecuta el método 'grafico_barra' donde lo primero que hacemos es borrar el contenido del control de tipo Canvas:
self.canvas1.delete(tk.ALL)
Recuperamos los tres valores ingresados en los controles Entry y obtenemos el mayor de ellos:
        valor1=int(self.dato1.get())
        valor2=int(self.dato2.get())
        valor3=int(self.dato3.get())
        if valor1>valor2 and valor1>valor3:
            mayor=valor1
        else:
            if valor2>valor3:
                mayor=valor2
            else:
                mayor=valor3
La ecuación para obtener el largo de la barra será:
largo=votos del partido/votos del partido con mas votos * 400 píxeles.
Entonces los largos de las tres barras se calculan:
        largo1=valor1/mayor*400
        largo2=valor2/mayor*400
        largo3=valor3/mayor*400
Dibujamos las tres barras:
        self.canvas1.create_rectangle(10,10,10+largo1,90,fill="red")
        self.canvas1.create_rectangle(10,120,10+largo2,200,fill="blue")
        self.canvas1.create_rectangle(10,230,10+largo3,310,fill="green")
Imprimimos un texto dentro del control Canvas mediante la primitiva 'create_text':
        self.canvas1.create_text(largo1+70, 50, text="partido A", fill="white", font="Arial")
        self.canvas1.create_text(largo2+70, 160, text="partido B", fill="white", font="Arial")
        self.canvas1.create_text(largo3+70, 270, text="partido C", fill="white", font="Arial")
Problema:
Crear una aplicación que solicite el ingreso de tres valores por teclado que representan las cantidades de votos obtenidas por tres partidos políticos. Luego mostrar un gráfico de tartas:.
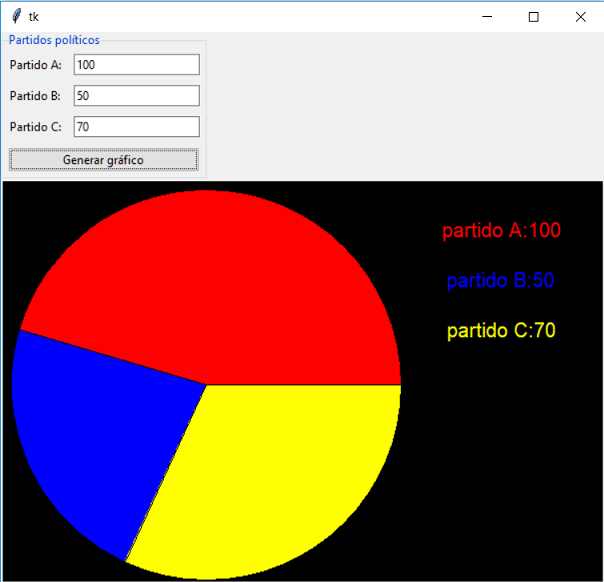
La interfaz visual debe ser similar a esta:
Programa: ejercicio256.py
import tkinter as tk
from tkinter import ttk

class Aplicacion:
    def __init__(self):
        self.ventana1=tk.Tk()
        self.entradadatos()
        self.canvas1=tk.Canvas(self.ventana1, width=600, height=400, background="black")
        self.canvas1.grid(column=0, row=1)
        self.ventana1.mainloop()

    def entradadatos(self):
        self.lf1=ttk.LabelFrame(self.ventana1,text="Partidos políticos")
        self.lf1.grid(column=0, row=0, sticky="w")
        self.label1=ttk.Label(self.lf1, text="Partido A:")
        self.label1.grid(column=0,row=0, padx=5, pady=5)
        self.dato1=tk.StringVar()
        self.entry1=ttk.Entry(self.lf1, textvariable=self.dato1)
        self.entry1.grid(column=1, row=0, padx=5, pady=5)
        self.label2=ttk.Label(self.lf1, text="Partido B:")
        self.label2.grid(column=0,row=1, padx=5, pady=5)
        self.dato2=tk.StringVar()
        self.entry2=ttk.Entry(self.lf1, textvariable=self.dato2)
        self.entry2.grid(column=1, row=1, padx=5, pady=5)
        self.label3=ttk.Label(self.lf1, text="Partido C:")
        self.label3.grid(column=0,row=2, padx=5, pady=5)
        self.dato3=tk.StringVar()
        self.entry3=ttk.Entry(self.lf1, textvariable=self.dato3)
        self.entry3.grid(column=1, row=2, padx=5, pady=5)
        self.boton1=ttk.Button(self.lf1, text="Generar gráfico", command=self.grafico_tarta)
        self.boton1.grid(column=0, row=3, columnspan=2, padx=5, pady=5, sticky="we")
        self.entry1.focus()

    def grafico_tarta(self):
        self.canvas1.delete(tk.ALL)
        valor1=int(self.dato1.get())
        valor2=int(self.dato2.get())
        valor3=int(self.dato3.get())
        suma=valor1+valor2+valor3
        grados1=valor1/suma*360
        grados2=valor2/suma*360
        grados3=valor3/suma*360
        self.canvas1.create_arc(10,10,400,400,fill="red", start=0, extent=grados1)
        self.canvas1.create_arc(10,10,400,400,fill="blue", start=grados1, extent=grados2)
        self.canvas1.create_arc(10,10,400,400,fill="yellow", start=grados1+grados2, extent=grados3)
        self.canvas1.create_text(500, 50, text="partido A:"+str(valor1), fill="red", font="Arial")
        self.canvas1.create_text(500, 100, text="partido B:"+str(valor2), fill="blue", font="Arial")
        self.canvas1.create_text(500, 150, text="partido C:"+str(valor3), fill="yellow", font="Arial")


aplicacion1=Aplicacion()
En el método grafico_tarta lo primero que hacemos es borrar el contenido del control Canvas:
    def grafico_tarta(self):
        self.canvas1.delete(tk.ALL)
Extraemos los tres valores ingresados en los controles Entry:
        valor1=int(self.dato1.get())
        valor2=int(self.dato2.get())
        valor3=int(self.dato3.get())
Sumamos la cantidad total de votos de los tres partidos:
suma=valor1+valor2+valor3
Seguidamente calculamos los grados que le corresponde a cada trozo de tarta (teniendo en cuenta que tenemos 360 grados para repartir), Cada trozo de tarta lo obtenemos mediante la ecuación:
tamaño trozo= cantidad de votos del partido / total de votos * 360
Los tres trozos se calculan con:
        grados1=valor1/suma*360
        grados2=valor2/suma*360
        grados3=valor3/suma*360
Graficamos los tres trozos de tarta mediante la primitiva 'create_arc':
        self.canvas1.create_arc(10,10,400,400,fill="red", start=0, extent=grados1)
        self.canvas1.create_arc(10,10,400,400,fill="blue", start=grados1, extent=grados2)
        self.canvas1.create_arc(10,10,400,400,fill="yellow", start=grados1+grados2, extent=grados3)
Finalmente mostramos las leyendas de los partidos junto con la cantidad de votos dentro del control Canvas:
        self.canvas1.create_text(500, 50, text="partido A:"+str(valor1), fill="red", font="Arial")
        self.canvas1.create_text(500, 100, text="partido B:"+str(valor2), fill="blue", font="Arial")
        self.canvas1.create_text(500, 150, text="partido C:"+str(valor3), fill="yellow", font="Arial")
Problema propuesto
-
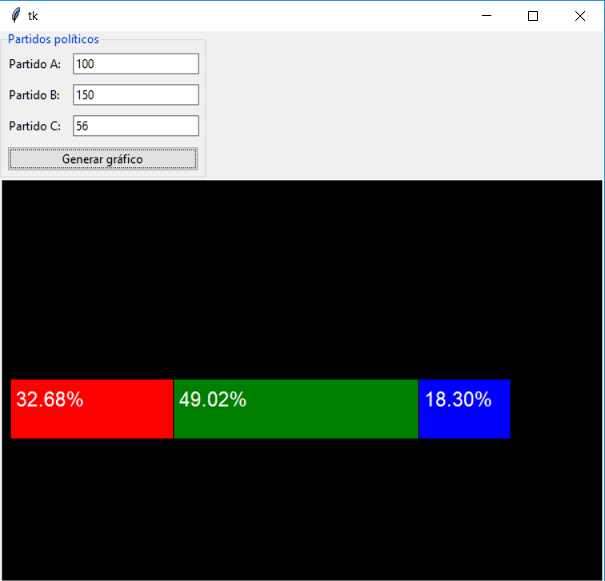
Implementar un gráfico estadístico de tipo "Barra Porcentual":
ejercicio257.py

import tkinter as tk
from tkinter import ttk

class Aplicacion:
    def __init__(self):
        self.ventana1=tk.Tk()
        self.entradadatos()
        self.canvas1=tk.Canvas(self.ventana1, width=600, height=400, background="black")
        self.canvas1.grid(column=0, row=1)
        self.ventana1.mainloop()

    def entradadatos(self):
        self.lf1=ttk.LabelFrame(self.ventana1,text="Partidos políticos")
        self.lf1.grid(column=0, row=0, sticky="w")
        self.label1=ttk.Label(self.lf1, text="Partido A:")
        self.label1.grid(column=0,row=0, padx=5, pady=5)
        self.dato1=tk.StringVar()
        self.entry1=ttk.Entry(self.lf1, textvariable=self.dato1)
        self.entry1.grid(column=1, row=0, padx=5, pady=5)
        self.label2=ttk.Label(self.lf1, text="Partido B:")
        self.label2.grid(column=0,row=1, padx=5, pady=5)
        self.dato2=tk.StringVar()
        self.entry2=ttk.Entry(self.lf1, textvariable=self.dato2)
        self.entry2.grid(column=1, row=1, padx=5, pady=5)
        self.label3=ttk.Label(self.lf1, text="Partido C:")
        self.label3.grid(column=0,row=2, padx=5, pady=5)
        self.dato3=tk.StringVar()
        self.entry3=ttk.Entry(self.lf1, textvariable=self.dato3)
        self.entry3.grid(column=1, row=2, padx=5, pady=5)
        self.boton1=ttk.Button(self.lf1, text="Generar gráfico", command=self.grafico_barraporcentual)
        self.boton1.grid(column=0, row=3, columnspan=2, padx=5, pady=5, sticky="we")
        self.entry1.focus()

    def grafico_barraporcentual(self):
        self.canvas1.delete(tk.ALL)
        valor1=int(self.dato1.get())
        valor2=int(self.dato2.get())
        valor3=int(self.dato3.get())
        suma=valor1+valor2+valor3
        largo1=valor1*500/suma
        largo2=valor2*500/suma
        largo3=valor3*500/suma
        porc1=valor1/suma*100
        porc2=valor2/suma*100
        porc3=valor3/suma*100
        self.canvas1.create_rectangle(10,200,10+largo1,260,fill="red")
        self.canvas1.create_text(50, 220, text="{0:.2f}".format(porc1)+"%", fill="white", font="Arial")
        self.canvas1.create_rectangle(10+largo1,200,10+largo1+largo2,260,fill="green")
        self.canvas1.create_text(50+largo1, 220, text="{0:.2f}".format(porc2)+"%", fill="white", font="Arial")
        self.canvas1.create_rectangle(10+largo1+largo2,200,10+largo1+largo2+largo3,260,fill="blue")
        self.canvas1.create_text(50+largo1+largo2, 220, text="{0:.2f}".format(porc3)+"%", fill="white", font="Arial")


aplicacion1=Aplicacion()